

When working with big datasets, it is useful to be able to investigate correlations between records. Knowing most popular components of an application or highest usage of a feature can help a team prioritize their efforts. One technique I’ve used is to group results by month to visualize the trend line of a query.
Visualizing data
Being able to visualize data is extremely useful. I recommend Metabase for analyzing your data. If you configure this I would also recommend that you have it running of a follower database. This is a database that matches production but is only used for read only procedures. Also it won’t slow down production since it is a copy of what is live.
When communicating with your team, being able to visualize data allows for easier communication. Showing numbers can be harder to understand the importance of versus a graph showing trend over time.
Setting the stage
For this article, let’s use a simple blog app as our architecture here. We’re only going to utilize a single database table Posts. Using this data we want to answer the following question, “How many Posts are published each month?”.
The first step I take is to build the foundational query. This will retrieve all posts and return a total count.
SELECT COUNT(posts.id) as total_posts
FROM posts
Truncating Timestamps
Now that we have the basic query above we can calculate posts per month. There are several
different approaches to solving this but we’re going to focus on the DATE_TRUNC technique. This
Postgres function allows us to take a timestamps and truncate it to the nearest unit of time we specify. We also need to group our results by the truncated date so that the aggregate COUNT can still be utilized. So from the above if we want to truncate our published_at date by month we can write the following query:
SELECT
  COUNT(posts.id) as total_posts,
  DATE_TRUNC('month', posts.published_at) as month
FROM posts
GROUP BY month
The above will split results out by month giving you output that looks like the following table:
| Month | Total Posts |
|---|---|
| September 1, 2023 12:00am | 30 |
| August 1, 2023 12:00am | 42 |
| July 1, 2023 12:00am | 66 |
What this essentially did was take every posts.published_at and truncate them to the first of the month for the month they resided in. We’ve now answered our first question, “How many Posts are published each month”.
There’s a gotcha here though. Over time the number of Posts published grows and grows. At some point in the future there are so many Posts that running this query become non-performant. Luckily we can constraint it by time interval to look at a subset of all available data.
Using Intervals
Intervals refer to a specific period of time which can be used to calculate offset dates. We can use this to constrain our results to the last 6 months with the below sql:
SELECT
  COUNT(posts.id) as total_posts,
  DATE_TRUNC('month', posts.published_at) as month
FROM posts
WHERE posts.published_at > CURRENT_DATE - INTERVAL '6 months'
GROUP BY month
The new where clause WHERE posts.published_at > CURRENT_DATE - INTERVAL '6 months' ensures that all published posts are only within the last 6 months of the current date set by postgres. This addition allows us to keep our results efficient and quick.
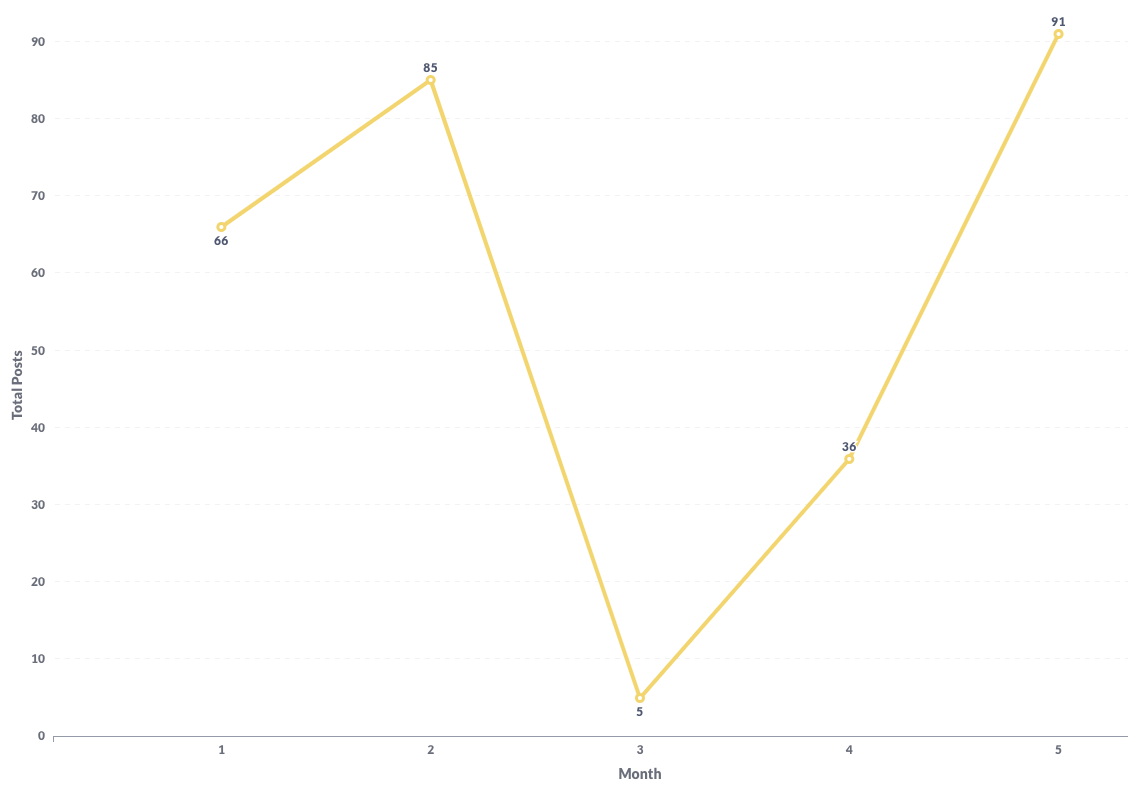
If you place the above query into a system like Metabase, set the x-axis to month and the y-axis to total posts you can end up with visualizations like the screenshot below. This makes it easy to see trends and possible correlations over time.
You can utilize the above for more complex statistics and datasets. Got another timestamp trick you like to use? Let me know in the comments below.
When is an Array an Array? Strategies for checking Array equality in Ruby
Using Turbo Frame tags within a ViewComponent
Join the conversation