

A common theme I’ve noticed throughout my career is that every product, every feature, and every company eventually hits a threshold in their application of what was designed to support. Once this magic threshold is reached, the application starts to fall down the technical debt cliff. Now, I’m not saying that this is due to bad design or bad decisions, really it is just that technical debt is difficult to identify and more difficult to prioritize. It isn’t building new features or fixing existing bugs, but rather building better architecture for the future. That’s tough to sell as something worth investing in. In this article, we’ll discuss several metrics for identifying technical debt in your application.
What is Technical Debt?
First off, what exactly is technical debt?
From my experience, technical debt is the accumulation of inconsistent or unideal architecture that is prone to failure, resistant to change, and difficult to build upon.
Martin Fowler defines technical debt with the following quote:
Software systems are prone to the build up of cruft - deficiencies in internal quality that make it harder than it would ideally be to modify and extend the system further. Technical Debt is a metaphor, coined by Ward Cunningham, that frames how to think about dealing with this cruft, thinking of it like a financial debt. The extra effort that it takes to add new features is the interest paid on the debt.
Martin Fowler
Cruft is a great vocabularly word to describe technical debt.
Technical cliffs on the otherhand refers to the point at which a current system can no longer support a feature or process. This happens when technical debt builds up to such a degree that the system begins to fail consistently. Some examples of technical debt cliffs are: known slow performance hotspots receiving more traffic, database contention between queries, and background jobs failing to finish in a timely manner.
A less dense perspective to technical debt, would be the following house construction metaphor:
- You’re building a new home
- You only have so much money to spend on construction that you decide to cut a few corners early on
- Later, construction is going well, foundation is being poured, walls are going up but eventually at some point the corners you cut begin to resurface
- One of the corners you cut was to use old copper piping for the plumbing. Now the pipeing is rusting and leaking throughout the home.
- When you start to replace the piping with PVC, you realize that the corner you cut with wiring has caused several electrical fires within the walls. Yeesh, that’s bad.
- Eventually all these little cut corners begin to add up to a single major problem. You’re out of funds but that house isn’t built yet.
Technical debt is a lot like this. The level of quality that you take to build it ensures that the home lasts longer. Building to quickly or without regard for quality might allow you to finish the home sooner at the cost of more issues with the home later down the road. Once there is significant technical debt present, it makes changing and/or fixing things like trying to crawl through mud.

But what about Legacy Code?
Notice how I never mentioned the phrase “legacy code”. That’s because legacy code (or code that is older) does not automatically make it technical debt. Legacy code can be thought of as code that has weathered the requirements of the application over a long period of time. The code was good enough at the time it was written to last long into the future. In simpler phrasing, legacy code is not inherently bad code. In fact, newly written code can quickly become technical debt when it reaches its solution through less than ideal means. I’ve seen it happen.
Ok, ok, ok… So why do I care?
Stepping down from my soapbox, I believe that too often existing and new architecture is not evalutated further than the thought of, “Well it works so why are spending time on it?”. The pitfall with this style of thinking is that when that code encounters a failure, the team has to respond to it reactively. Remember the section above describing what technical cliffs were? Technical cliffs often are difficult to fix and challenging to reproduce.
When your team is fixing technical debt reactively the time you spend finding a solution and implementing is accelerated from the actual time you need to implement a longer lasting solution. Conversly, a proactive approach allots for adequate time deciding on well thought out solutions, fully tested quality, and implemented in an effort not to further dig into the technical debt hole.
Still unconvinced?
If you’re still feeling unconvinced or the above doesn’t seem like a valid business reason to invest in improving known debt, think about the following statements.
- The more clients that use your product the more likely it is you’ll encounter technical cliffs
- Larger clients accelerating you to known/unknown thresholds more quickly
- Reacting to technical cliffs is only a viable strategy as long as the solutions implemented don’t end up creating additional technical debt
- More technical cliffs, means more application failures, which is frustrating for end-users
All of the above leads to clients having less confidence in your product and more frustration while using it. Lack of confidence and frustration are great reasons to begin seeking out alternatives that contain less of a headache.
There are other reasons for pursuing a culture of managing technical debt. I hope I’ve at least convinced you that technical debt is important to consider when building new features.
In the next section, I’ve outlined a framework of metrics to help identify, prioritize, and educate your team on technical debt cliffs and their estimated risk.
Metrics for identifying Technical Debt cliffs and their risk
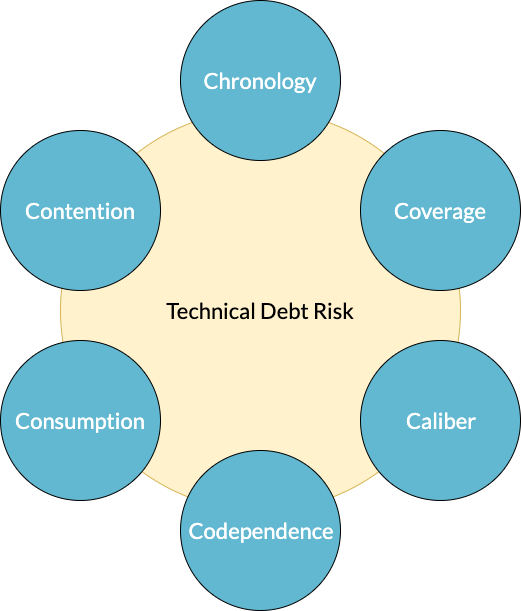
Above, I’ve listed out 6 different metrics for identifying technical debt: Chronology, Coverage, Caliber, Codependence, Consumption, Contention. These metrics aren’t meant to be used in isolation but rather as parts of the greater whole. This is because some metrics are lagging, others are leading, and the rest are coincident indicators. I use these terms from market analysis but in the context of a software application.
- Lagging indicators are factors that lag behind technical cliff events
- Leading indicators indicate future technical cliffs
- Coincident indicators are factors that occur simultaenously with technical cliffs
I also believe that some of these metrics indicate more risk than others. If your code is 5 years old but your rate of incidence is low then that area of the application might be at lower risk. Just looking at the one of these metrics alone wouldn’t allow you to reach a supported hypothesis.
This framework is meant to be used as a guide. Use your best judgement given your own specific situation along with a healthy dose of inquisitivenss. With that let’s dig into these a bit deeper.
Chronology
Chronology, also could be called age, is the last moment in time this part of the application was modified. You could equate this to saying, “How old is the code?”. Now some of you might be reacting to this statement with, “Uh, huh. Didn’t you just say legacy code isn’t technical debt?”. And you’d be right.
When I refer to the chronology of the code, this is only meant to be used as a lagging indicator. I truly believe that legacy code does not equal technical debt. Instead chronology can be used a way to get closer to various older parts of the codebase. Maybe your user sign in process is 5 years old. A quick run through of the code shows that it works efficiently. Alternatively looking back through it you notice an edge case where users can potentially request password resets for other users. Good thing we you did some quick discovery into it.
Think about cleaning different areas of your home. Some may remain clean for weeks while others are constantly dirty. You’ll only know if an area needs to be cleaned if you take the time to investigate it. Same idea with older code in your codebase.
One way to calculate how old code is, is to check the git blame details for the file in question. This details line-by-line the last time commit that effected the code
with the last contributor listed alongside it. I’ve begun looking into ways of automating this utilizing git ls-tree by recursively searching through all tracked files
and building a data structure for each. Github (or other online repository applications) can also be a good place to look as they often include a way to check a file’s history.
Chronology of code can indicate a section of your codebase that needs to be revisited. I believe that this metric should be thought of as lower risk as chronology of code doesn’t always indicate technical debt.
Coverage
If you’re only going to look at one of these metrics, then Code Coverage is one of the most important. Coverage measures the percentage of well tested code in your codebase. This is presented as a ratio of available code to lines tested.
Missing test coverage in wide sections of a codebase, is a recipe for disaster. You’ll have no idea when a change elsewhere in the application has wide reaching consequences. Not only that but you’ll waste time fixing the issue by having to also write tests that should have already been written originally.
I come from a Ruby environment, which means I’m most familar with SimpleCov. SimpleCov allows you to capture statistics around your test suite along with outputting them in an easy to view HTML format. This is really a great tool for discovering those low coverage areas in your application.
Well tested code increases confidence and consistency in business logic resulting in less overall bugs and less time spent debugging. Code Coverage is a leading indicator meaning that less coverage can indicate where future problems will occur. From my perspective, this metric holds a high risk as you can’t be confident that code works without it being properly tested.
Caliber
Overall caliber of code can ensure that future code is written with a high degree of craftsmanship and quality. There are many tools for measuring this. Static analysis and linters are some of the best types of tools to generate more insight into a codebase.
Following general community standards and best practices helps to ensure that code is built well the first time. Generally there are very good reasons as to why the community agreed upon a specific standard. Though some standards are more up to preference the important thing here is to decide on a single standard and follow it. If your company decides to follow Airbnb’s JavaScript styleguide, then make sure you have ways to enforce this decision. Also make the necessary exceptions and changes to your own local style that support your team’s culture. Below I’ve listed a non-exhaustive list of examples that support the caliber metric:
- Rubocop for Ruby static analysis
- Stylelint for CSS/SCSS linting
- ESlint for JavaScript linting
- Reek for detecting general code smells in Ruby
In addition to being superb tools for measuring standard of code, many of these can also be configured to automatically fix the underlying rules that they run. This means that things like line length can be set to automatically wrap at a set numerical threshold. Less work to ensure high quality. Nice!
Integrating this into your culture is essential for ensuring well crafted code. Do code reviews take into account your styleguide? Do you foster an environment that encourages team member skill development? Processes like these keep code simple and flexible to future change.
Like Code Coverage, Caliber tends to be a leading indicator of code locations where you’ll experience strife in the future. This can also be considered as requiring a higher weight in terms of monitoring the overal caliber of a system.
Codependence
Codependence refers to how coupled a particular part of your application is with other parts. The more coupled your code is the less flexible it is to future change. Dependencies can come in two general flavors: Internal and External.
Breaking this down a bit more, if you have a class that requires at least 3 other classes in the system to function then you could think of this single class as having 3 dependencies. ActiveRecord could be thought of as a dependency.
Now, dependencies aren’t necessarily a bad thing. Neither is highly coupled code. Both of which, when used judiciously, can be effective solutions. Applications couldn’t function without depending on at least several other concerns. The important thing to remember here is to limit the number of dependencies that a single unit requires. If limiting dependencies is difficult to impossible, then building the dependencies and consumers of the dependencies in a flexible manner helps to mimize future risk and technical debt.
An example of what to avoid could be a single class that takes in dependencies as well as calling out to several other dependencies. The dependencies it calls out to then have additional dependencies that they call out to. This style of stacking dependency ontop of dependency where the process can’t function without one quickly can become a house of cards. A bug in one dependency instead of requiring a single fix, could require a large fix to the overall dependency chain. Dependency injection is a great way to avoid such headaches. This sounds like a complicated phrase but in reality it means supply your class with the objects it depends on. Hanami has a great tutorial on the subject.

In terms of measuring internal dependencies, there are a few ways in which I think about this. From a Ruby perspective:
- How many arguments does your class’s
#initializemethod accept? Are some optional? - Are the arguments passed into your class in the format they will be used in? (e.g. instead of calling another class pass in the built object as an argument)
- How many of the methods within your class call other classes throughout the system? Do those dependencies call other dependencies?
Considering external dependencies, things like what version of Rails are you using? React? Is it up-to-date? Keeping external depedencies up-to-date ensures that you continue to design code that is built in a way that the dependency author intended. Keeping a pulse on your external dependencies is important for gaining new features, versions, and security updates.
Codependence is another leading indictator metric which could be monitored through static analysis. I say leading indicator as having a large number of dependencies or a chain of dependencies can indicate technical debt. A naive approach to this I’m currently toying with is some type of Rubocop rule that looks for calls to other classes in private methods. Instead it could guide you to utilizing dependency injection to craft flexible interfaces.
Consumption
By consumption, I don’t mean your code has Tuberculosis…
What I mean is, what is the quantity of usage that your code pathways receive. Maybe your user signup process receives 5,000 requests everyday. Maybe it only receives 100. Knowing the amount of interaction a process in your codebase receives allows for better prioritization of technical debt initiatives.
Priorization allows for concentrating engineering team effort around technical debt where that debt has a high usage rate. More usage in a higher concentration of technical debt can indicate an area of your application that should be improved before other technical debt. This is pretty much a, “Duh! If it is used more then fix it first” but it still is worth considering when identifying debt.
You can measure the consumption through many application monitoring tools. Some great examples of these are listed below:
This metric is a leading and coincident indicator. It is leading because as you notice trends in application usage you can predict hotspots in the system. By coincident I mean that a spike in usage can uncover technical debt cliffs really fast. Did you just sell to a large enterprise client? This might accelerate to unknown technical debt cliffs based on the influx of usage.
Contention
While consumption above refers to usage rate, contention refers to failure rate. How often does a single process in your codebase experience failure? Is it happening everyday? Hour? Second? This is important for uncovering current technical debt as well as future debt. I believe that this metric and consumption above work in tandem by helping identify areas of an application that should be improved before others.
Let’s say you have an area of high contention but low usage (maybe only a single client uses the feature) then you can decide on appropriate priority. Area of low contention but high usage? This could indicate part of the application that is causing widespread user frustration. Minimizing areas of contention leads to greater client happiness.

Contention is a lagging and coincident indicator. It generally lags behind technical debt while happening coincidently at the same time as a spike in errors. Contention is something that you can see happen with good error reporting and customer ticket handling. Giving customers a way to report issues is a great way to capture this metric. I always have the thought that if one person is reporting an issue there are likely at least 5 others that have already seen it and closed your application.
Like above there are lots of great tools out there. Here’s a few listed below:
- Honeybadger for error reporting
- Rollbar also for error reporting
- Zendesk for customer support and ticket handling
Putting it all together
Now that I’ve detailed the above 6 metrics, technical debt can be thought of through multiple lenses. Each of the above is important in its own right. From predicting future debt to prioritizing current debt, they all function as a single framework. Quickly reviewing the above, some highlights:
- (Chronology) Chronology of code can indicate a section of your codebase that needs to be revisited
- (Code Coverage) Well tested code increases confidence and consistency
- (Caliber) Following general community standards and best practices helps to ensure that code is built well the first time
- (Codependence) The more coupled your code is the less flexible it is to future change
- (Codependence) Keeping a pulse on your external dependencies is important for gaining new features, versions, and security updates
- (Consumption) Knowing the amount of interaction a process in your codebase receives allows for better prioritization of technical debt initiatives
- (Contention) Minimizing areas of contention leads to greater client happiness
A lot of the above needs to be considered with the context of the other metrics. High Contention but low Consumption might be lower priority than low Coverage and high Consumption. It really depends on your application’s situation. In future articles in this series, I’d like to dive deeper into prioritzing the highest risk, strategies to begin reducing technical debt, and practical examples of measuring these metrics.
This article has got me thinking through= a system with the capacity to highlight high risk areas of an application. Being able to see the overlap between the above risk factors and metrics would give greater insight to not only software engineers but management and executives alike.
Some acknowledgments on this post include my colleages at Lessonly for helping shape the Codependence metric and my wife for listening to me talk about the topic of technical debt way to much.
Do you have any guidelines for identifying technical debt? Is there one I should add to the above? Let me know with a comment below and as always thanks for reading.
Invalidate requests when a user session contains null bytes in the Rack layer
Configuring Letter Opener for Hanami development environment
Join the conversation