

Alright, bit of a clickbait title but if you know me you’ll know my love for bad puns. Ensuring a healthy running application is an important part of your infrastructure reliability. Site Reliabiltiy is an entire discipline by itself as there are a wealth of topics and concepts associated with it. That being said having really solid Site Reliability as a start-up isn’t always the first priority. This article details some of the steps I’ve taken to have basic application monitoring in place easily and cheaply.
Going into this article I’ll assume you have an error reporting service tracking application errors, I use Honeybadger, along with a communication platform, such as Slack.
Site Reliability and Start-up life
Start-ups are scrappy little things that move fast and break things. This mentality really resonates with me as you can get a lot done if you practice “good enough” programming. However, we still need a way to ensure if (more like when) we break things we are able to recover and track them. With that said here are the goals we’re looking to gain greater visibility with:
- Error Reporting
- Application uptime
- Infrastructure & Service outtages
Slack happens to be a great tool for ensuring communication stays open between contributors within an organization. I find myself nowadays using it almost exclusively over Email. Given how often I’m in there I wanted to also consolidate my application notifications there as well. This helps avoid context switching between external services, email, etc.
With that in mind let’s dig into making a foundational site reliability layer for our application.
Errors in realtime
First off we’ll need some new channels in Slack to monitor application statuses. You can name these however you want. I
personally used the following: devops and devops-staging to denote production and staging environments.
In your Error Reporting service of choice (again we’ll be using Honeybadger), there should be some way of setting up and integration for Slack. Honeybadger’s is located under Settings -> Alerts & Integrations.
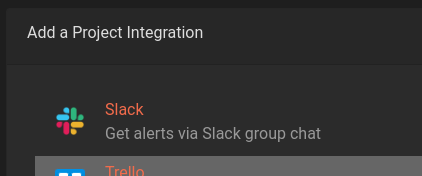
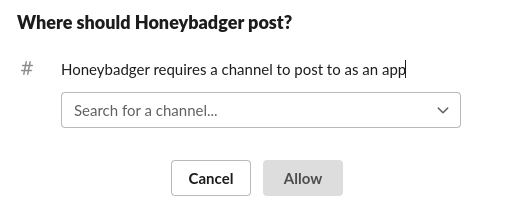
This will send you through an Oauth process and ask permission from Slack to post to a specific channel on behalf of the Honeybadger bot.
From this point you can decide what types of Error messaging is sent to your Slack channel. Additionally,
you can specify environment to monitor. This is super useful for our first channel devops as it can focus
on production and demo environments which are high-impact to customers. devops-staging can instead specify
staging and review environments while still important can be moved to a seperate channel. It’s a good idea
to expose errors in both your production and staging environments, as staging can give you early warning to
an issue that is about to be deployed to production.
It's a good idea to expose errors in both your production and staging environments, as staging can give you early warning to an issue that is about to be deployed to production.
With this in place, you’ll begin seeing errors appear in real-time within Slack. A tip with managing Error Reporting services, is to always ensure the total number of unresolved errors is zero. As errors emerge they should be immediately remediated either through code or leaving comments on them within the Error Reporting service.
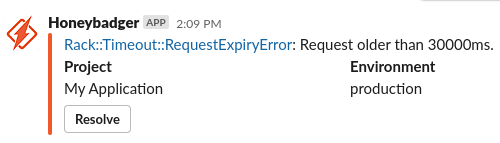
Conviently having your errors within Slack allows fast notification as well as helpful actions that can be taken directly from Slack.
Application uptime
In addition to error reporting, we also want to know if the application stops responding to web requests. This is known as application uptime. When this occurs it should be resolved immediately to reduce service disruption. Honeybadger still has our back here as there is a specific page for uptime checks.
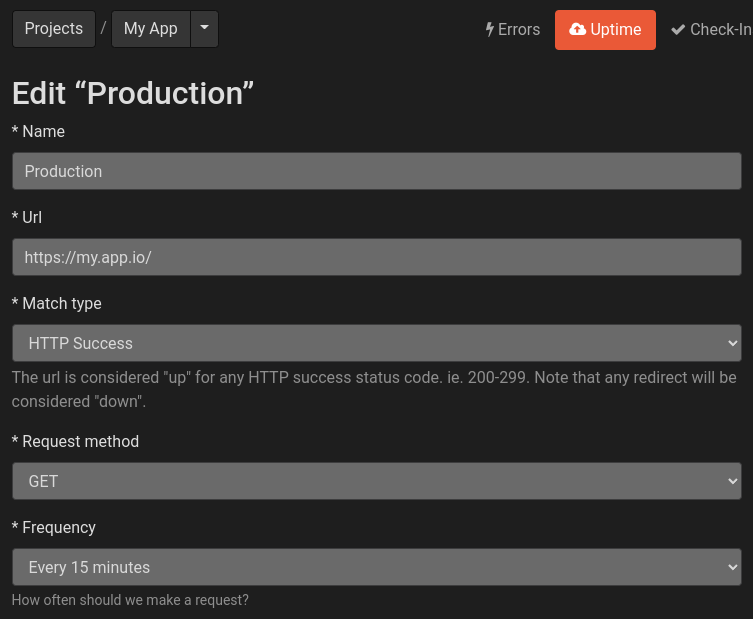
Using your production application’s url, will allow Honeybadger to periodically check to ensure a 200 success is received. If at any point the check fails (or a redirect occurs), it will notify the Honeybadger service. In order to put this into Slack as well we’ll need to modify the previously created Slack integration (reminder: Settings -> Alerts & Integrations). On the integration setup page there is a section down the page which allows for us to attach configured uptime checks to the Slack integration
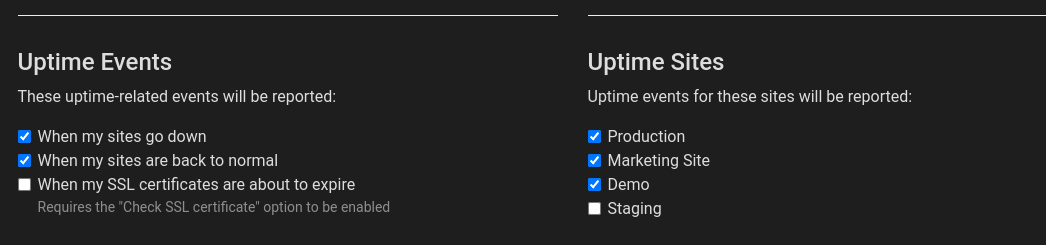
If you look on the right side of the above picture, you’ll see Uptime Sites “marketing site”. I find it useful if you are running an application which has both a marketing url and application url if both are monitored through your Slack notifications. With this in place we’ll start receiving alerts for application outtages.
Infrastructure & Service outtages
Similiar to Application Uptime, we have external services which our application relies on but which we have little to no control over. Such services as Heroku, Github, AWS, and others which power web applications. We’d like to be aware of these in case customers (and internal team members) experience issues that we can describe the underlying issue with clarity.
We still want to see these outtages within Slack. So how do we accomplish that? There are definitely some plugins (most paid)
which allow for setting up uptime alerts but there’s a free and simple way to get these. Slack gives access to the /feed
command which allows a specific channel to subscribe to an RSS or atom news feed. Given that most services have status pages
with subscription options we can leverage that to add these to a feed listing.
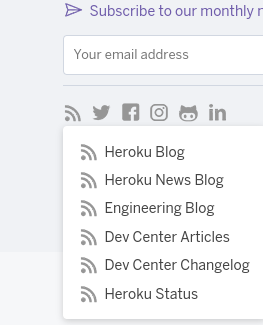
Often services use the naming convention of status.service-name.com for their status page. Generally these contain
methods for subscribing to the raw feed url. Sometimes these urls are hidden or require subscribing with an email. Heroku’s
for instance is in a drop-down menu under their RSS icon labeled “Heroku Status”.
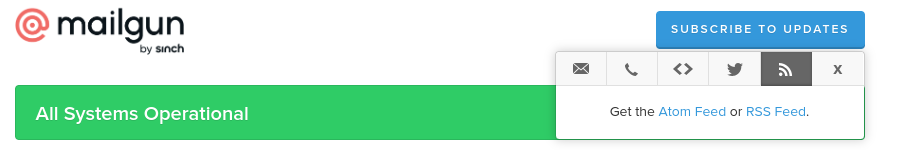
Mailgun on the other hand is much easier to find being under the subscribe menu’s rss icon.
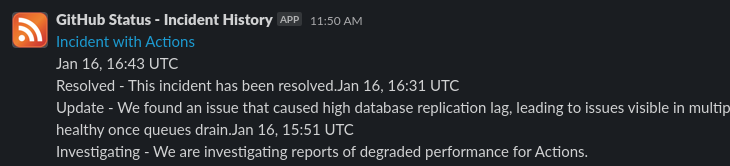
Once you’ve discovered the feed urls for your services, you can easily add them to a Slack channel using /feed subscribe url-to-feed.
I’d recommend these are added to a seperate channel than devops or devops-staging. Personally I used vendor-status. With this
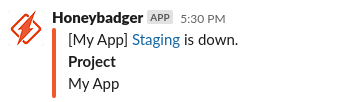
in place you’ll begin to see notifications for infrastructure service disruptions.
Conclusion
With the above in place, we have a basic level of monitoring in place for our early application. This allows for application status to be communicated through Slack giving greater visibility and faster remediation response times.
Like I’ve mentioned before this is geared towards a start-up application. That is an early application. This is not meant to be a in-depth or full harness for monitoring an application. Merely this is a way to keep a pulse on application health while at the beginning stages of a new product.
What’d you think of moving application status into Slack? Got a tip that could be added to this article? I’d love to discuss in the comments below.
Creating blurred background images with overlay text in CSS
How to fix homebrew postgres error 256
Join the conversation